


J'ai testé ce code, mais il le montre horizontalement
- Code: Select all
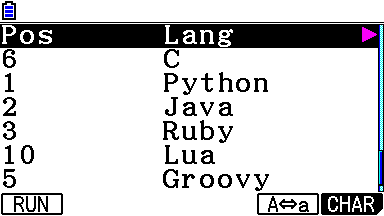
## Python program to print the data
d = {1: ["Python", 33.2, 'UP'],2: ["Java", 23.54, 'DOWN'],3: ["Ruby", 17.22, 'UP'],10: ["Lua", 10.55, 'DOWN'],5: ["Groovy", 9.22, 'DOWN'],6: ["C", 1.55, 'UP'] }
print ("{:<8} {:<15} {:<10} {:<10}".format('Pos','Lang','Percent','Change'))
for k, v in d.items():
  lang, perc, change = v
print ("{:<8} {:<15} {:<10} {:<10}".format(k, lang, perc, change))
Il existe un autre moyen ou bibliothèque d'utiliser et d'afficher des données dans des tableaux. si possible avec scroll

")


")