Afficher les données dans un tableau - python graph 90 + e
Il existe un moyen d'afficher des données tabulées, c'est-à-dire dans un tableau.
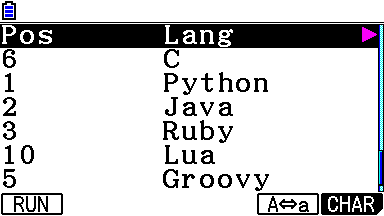
J'ai testé ce code, mais il le montre horizontalement
Il existe un autre moyen ou bibliothèque d'utiliser et d'afficher des données dans des tableaux. si possible avec scroll
J'ai testé ce code, mais il le montre horizontalement
- Code: Select all
## Python program to print the data
d = {1: ["Python", 33.2, 'UP'],2: ["Java", 23.54, 'DOWN'],3: ["Ruby", 17.22, 'UP'],10: ["Lua", 10.55, 'DOWN'],5: ["Groovy", 9.22, 'DOWN'],6: ["C", 1.55, 'UP'] }
print ("{:<8} {:<15} {:<10} {:<10}".format('Pos','Lang','Percent','Change'))
for k, v in d.items():
  lang, perc, change = v
print ("{:<8} {:<15} {:<10} {:<10}".format(k, lang, perc, change))
Il existe un autre moyen ou bibliothèque d'utiliser et d'afficher des données dans des tableaux. si possible avec scroll